ShopDreamUp AI ArtDreamUp
Deviation Actions
![[ai adopt] cute ladybug](https://images-wixmp-ed30a86b8c4ca887773594c2.wixmp.com/f/ddc18696-4f6c-45cb-9f33-d86c938029f4/dgs2d0l-37c8f2a3-a846-4f10-92a8-dc274be72327.jpg/v1/fill/w_350,h_350,q_70,strp/_ai_adopt__cute_ladybug_by_1dollaradopts_dgs2d0l-350t.jpg?token=eyJ0eXAiOiJKV1QiLCJhbGciOiJIUzI1NiJ9.eyJzdWIiOiJ1cm46YXBwOjdlMGQxODg5ODIyNjQzNzNhNWYwZDQxNWVhMGQyNmUwIiwiaXNzIjoidXJuOmFwcDo3ZTBkMTg4OTgyMjY0MzczYTVmMGQ0MTVlYTBkMjZlMCIsIm9iaiI6W1t7ImhlaWdodCI6Ijw9MTAyNCIsInBhdGgiOiJcL2ZcL2RkYzE4Njk2LTRmNmMtNDVjYi05ZjMzLWQ4NmM5MzgwMjlmNFwvZGdzMmQwbC0zN2M4ZjJhMy1hODQ2LTRmMTAtOTJhOC1kYzI3NGJlNzIzMjcuanBnIiwid2lkdGgiOiI8PTEwMjQifV1dLCJhdWQiOlsidXJuOnNlcnZpY2U6aW1hZ2Uub3BlcmF0aW9ucyJdfQ.r2sZPhv0pzydzQKoDwSLyLMO_cLPgGa3ckV9hJBbBu0)


Suggested Deviants


Suggested Collections


![Soldier | Humanoid [01/04]](https://images-wixmp-ed30a86b8c4ca887773594c2.wixmp.com/f/dbc4289f-30cd-4c74-becd-bf169be89f81/dgq0a7q-fbc5d214-dd38-43d2-9185-6f79a6fab0c8.jpg/v1/crop/w_184,h_184,x_0,y_15,scl_0.061827956989247,q_70,strp/soldier___humanoid__01_04__by_unfoldingboyar_dgq0a7q-92s-2x.jpg?token=eyJ0eXAiOiJKV1QiLCJhbGciOiJIUzI1NiJ9.eyJzdWIiOiJ1cm46YXBwOjdlMGQxODg5ODIyNjQzNzNhNWYwZDQxNWVhMGQyNmUwIiwiaXNzIjoidXJuOmFwcDo3ZTBkMTg4OTgyMjY0MzczYTVmMGQ0MTVlYTBkMjZlMCIsIm9iaiI6W1t7ImhlaWdodCI6Ijw9Mzk2OCIsInBhdGgiOiJcL2ZcL2RiYzQyODlmLTMwY2QtNGM3NC1iZWNkLWJmMTY5YmU4OWY4MVwvZGdxMGE3cS1mYmM1ZDIxNC1kZDM4LTQzZDItOTE4NS02Zjc5YTZmYWIwYzguanBnIiwid2lkdGgiOiI8PTI5NzYifV1dLCJhdWQiOlsidXJuOnNlcnZpY2U6aW1hZ2Uub3BlcmF0aW9ucyJdfQ.74_9Sdcf_If-wdbR-jt4Cgjzq3Kx1zXeGl9FpQ9SnW4)
![Soldier | Humanoid [01/04]](https://images-wixmp-ed30a86b8c4ca887773594c2.wixmp.com/f/dbc4289f-30cd-4c74-becd-bf169be89f81/dgq0a7q-fbc5d214-dd38-43d2-9185-6f79a6fab0c8.jpg/v1/crop/w_92,h_92,x_0,y_8,scl_0.030913978494624,q_70,strp/soldier___humanoid__01_04__by_unfoldingboyar_dgq0a7q-92s.jpg?token=eyJ0eXAiOiJKV1QiLCJhbGciOiJIUzI1NiJ9.eyJzdWIiOiJ1cm46YXBwOjdlMGQxODg5ODIyNjQzNzNhNWYwZDQxNWVhMGQyNmUwIiwiaXNzIjoidXJuOmFwcDo3ZTBkMTg4OTgyMjY0MzczYTVmMGQ0MTVlYTBkMjZlMCIsIm9iaiI6W1t7ImhlaWdodCI6Ijw9Mzk2OCIsInBhdGgiOiJcL2ZcL2RiYzQyODlmLTMwY2QtNGM3NC1iZWNkLWJmMTY5YmU4OWY4MVwvZGdxMGE3cS1mYmM1ZDIxNC1kZDM4LTQzZDItOTE4NS02Zjc5YTZmYWIwYzguanBnIiwid2lkdGgiOiI8PTI5NzYifV1dLCJhdWQiOlsidXJuOnNlcnZpY2U6aW1hZ2Uub3BlcmF0aW9ucyJdfQ.74_9Sdcf_If-wdbR-jt4Cgjzq3Kx1zXeGl9FpQ9SnW4)


![FOR SALE: Ravicci [SOLD]](https://images-wixmp-ed30a86b8c4ca887773594c2.wixmp.com/f/c3a51af5-5d84-431a-91f3-3a1f70e48f36/d67i7ad-5b3f88d2-fd40-49ee-af5f-8d300dae07f8.png/v1/crop/w_184,h_184,x_15,y_0,scl_0.26285714285714/for_sale__ravicci__sold__by_nachtbeirmann_d67i7ad-92s-2x.png?token=eyJ0eXAiOiJKV1QiLCJhbGciOiJIUzI1NiJ9.eyJzdWIiOiJ1cm46YXBwOjdlMGQxODg5ODIyNjQzNzNhNWYwZDQxNWVhMGQyNmUwIiwiaXNzIjoidXJuOmFwcDo3ZTBkMTg4OTgyMjY0MzczYTVmMGQ0MTVlYTBkMjZlMCIsIm9iaiI6W1t7InBhdGgiOiJcL2ZcL2MzYTUxYWY1LTVkODQtNDMxYS05MWYzLTNhMWY3MGU0OGYzNlwvZDY3aTdhZC01YjNmODhkMi1mZDQwLTQ5ZWUtYWY1Zi04ZDMwMGRhZTA3ZjgucG5nIiwiaGVpZ2h0IjoiPD00NTEiLCJ3aWR0aCI6Ijw9NjAwIn1dXSwiYXVkIjpbInVybjpzZXJ2aWNlOmltYWdlLndhdGVybWFyayJdLCJ3bWsiOnsicGF0aCI6Ilwvd21cL2MzYTUxYWY1LTVkODQtNDMxYS05MWYzLTNhMWY3MGU0OGYzNlwvbmFjaHRiZWlybWFubi00LnBuZyIsIm9wYWNpdHkiOjk1LCJwcm9wb3J0aW9ucyI6MC40NSwiZ3Jhdml0eSI6ImNlbnRlciJ9fQ.ntirRdAbksX3lj9ADhizTIyIMq8KnDkMJiQIrIT3vWw)
![FOR SALE: Ravicci [SOLD]](https://images-wixmp-ed30a86b8c4ca887773594c2.wixmp.com/f/c3a51af5-5d84-431a-91f3-3a1f70e48f36/d67i7ad-5b3f88d2-fd40-49ee-af5f-8d300dae07f8.png/v1/crop/w_92,h_92,x_8,y_0,scl_0.13142857142857/for_sale__ravicci__sold__by_nachtbeirmann_d67i7ad-92s.png?token=eyJ0eXAiOiJKV1QiLCJhbGciOiJIUzI1NiJ9.eyJzdWIiOiJ1cm46YXBwOjdlMGQxODg5ODIyNjQzNzNhNWYwZDQxNWVhMGQyNmUwIiwiaXNzIjoidXJuOmFwcDo3ZTBkMTg4OTgyMjY0MzczYTVmMGQ0MTVlYTBkMjZlMCIsIm9iaiI6W1t7InBhdGgiOiJcL2ZcL2MzYTUxYWY1LTVkODQtNDMxYS05MWYzLTNhMWY3MGU0OGYzNlwvZDY3aTdhZC01YjNmODhkMi1mZDQwLTQ5ZWUtYWY1Zi04ZDMwMGRhZTA3ZjgucG5nIiwiaGVpZ2h0IjoiPD00NTEiLCJ3aWR0aCI6Ijw9NjAwIn1dXSwiYXVkIjpbInVybjpzZXJ2aWNlOmltYWdlLndhdGVybWFyayJdLCJ3bWsiOnsicGF0aCI6Ilwvd21cL2MzYTUxYWY1LTVkODQtNDMxYS05MWYzLTNhMWY3MGU0OGYzNlwvbmFjaHRiZWlybWFubi00LnBuZyIsIm9wYWNpdHkiOjk1LCJwcm9wb3J0aW9ucyI6MC40NSwiZ3Jhdml0eSI6ImNlbnRlciJ9fQ.ntirRdAbksX3lj9ADhizTIyIMq8KnDkMJiQIrIT3vWw)


Description
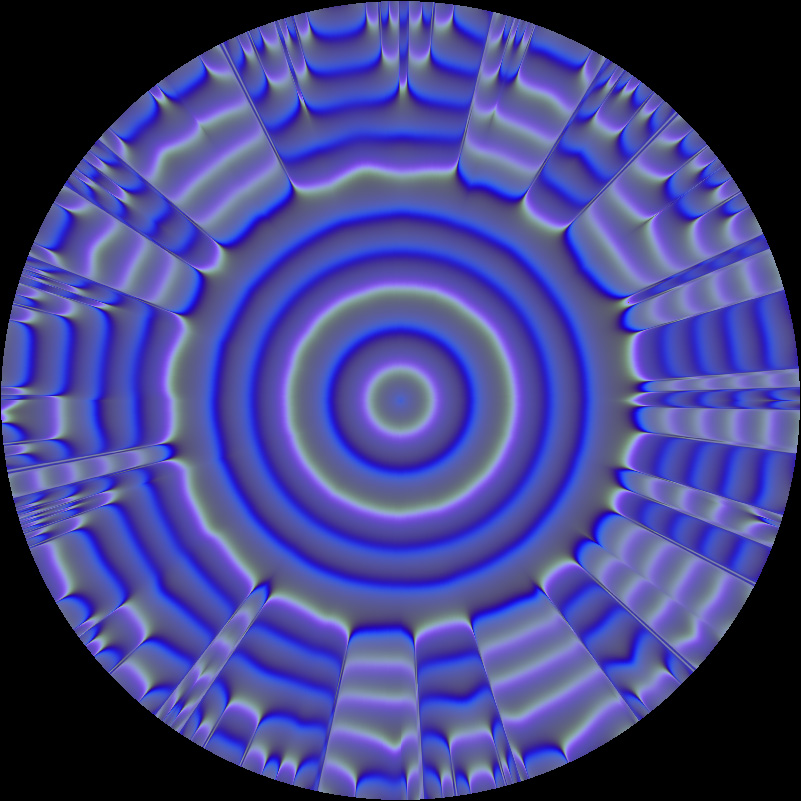
While reading Stephen Strogatz' sync, I got an idea. Chaos can appear in equations with at least three independent variables. There are also three colours in the RGB space. So each point on e.g. the Lorenz attractor can be mapped to a colour!
After several crazy ideas about how to create a colour image with the Lorenz equations, I found quite a good way. The radial direction in this image represents time. The angular direction represents different coordinates on the Lorenz attractor.
My C++ program begins with something like 100 points, very close to each other, and spawns new points as it goes outward for better angular resolution. It uses some interpolation and averaging in both the dynamics of the steadily increasing number of spatial points and in mapping the polar coordinate values onto cartesian grid values, which was a pain.
The image still captures much of the principles behind chaos. The blue and white circle segments means points are located at one of the Lorenz attractor's butterfly wings. As time goes, the dynamics of the points will be more and more different, even though they were very close the first five cycles. The Rössler attractor has a more funky colour palette, but less exciting dynamics.
Unfortunately, I'm not able to explain this abstract image any better. And the esthetic value is low for non-mathematicians. And again, there's no category fitting my non-mainstream work.
Image size
801x801px 199.64 KB
© 2009 - 2024 zigurdu
Comments1
Join the community to add your comment. Already a deviant? Log In